February 05, 2026
5 min read
editor

How to Read Candlestick Charts Like a Pro

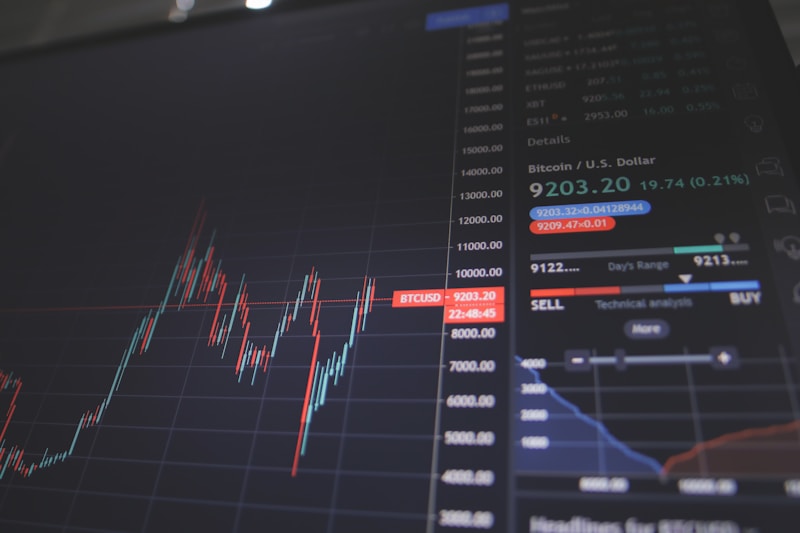
Candlestick charts are essential for technical analysis. Learn to read them effectively.

**Basic Patterns**
- Doji: Indecision in the market
- Hammer: Potential reversal signal
- Engulfing: Strong directional move

**How to Use Them**
Combine patterns with volume and support/resistance levels for best results.

e

editor

Investment analyst at Paxtrade with 10+ years of experience in financial markets and portfolio management.

More Articles

Continue exploring investment insights

Start Your Investment Journey

Join 45,000+ investors building wealth with Paxtrade

Create Free Account